 optimaL
See optimaL in a real sales list
The demo sales list shows the tool’s output on sample data. Walk through individual cases step by step to understand how it works.
What optimaL adds to your list
8 additional columns
- 2 AI-recommended discounts (%)
- 1 AI note on data quality
- 5 types of resulting revenue gain or loss (€)
6 statistics worksheets
- Performance of all customers, regions and products
- 2 sheets on team achievements
- Monthly revenue overview
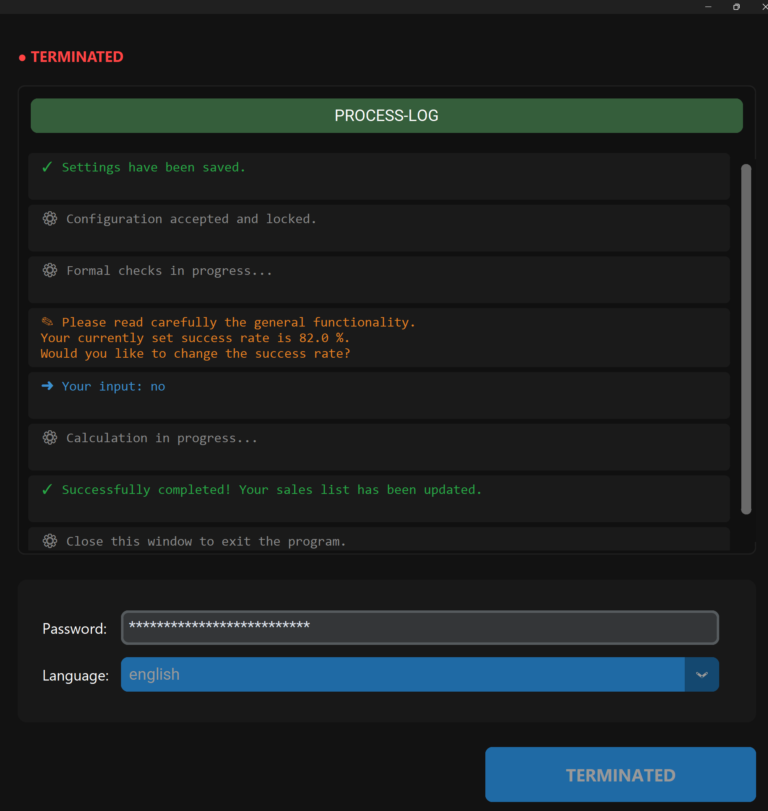
17 mandatory input fields are needed for a recommendation. The demo also contains 7 optional columns to show how the tool adapts to your internal sales structure.
How to read the demo: row 7
Customer Wolf from the USA wants to buy 5 units of product J. The sales team rates the product-need fit at 80 % and the deal confidence at 80 %.
The team initially plans a discount of 20.18 %. optimaL recommends 19.02 %. Taking this into account, a final discount of 19.7 % is agreed.
The deal is sold on 01.08.2025. By including the AI recommendation, an additional revenue of 1,150.20 € was achieved (20.18 % – 19.7 % = 0.48 %).
Worth exploring
- Consistency: follow other “sold” and “not sold” cases.
- Risk and reward: rows 71 and 242 show cases where the recommendation led to a loss.
- Neutral cases: in rows 4 and 14 the recommendation had no effect.
- Guidance: the AI note (e.g. row 5) shows when data is missing for a reliable recommendation.
- Statistics: the worksheets for customers, regions, products, team and monthly revenue.
Monthly revenue overview
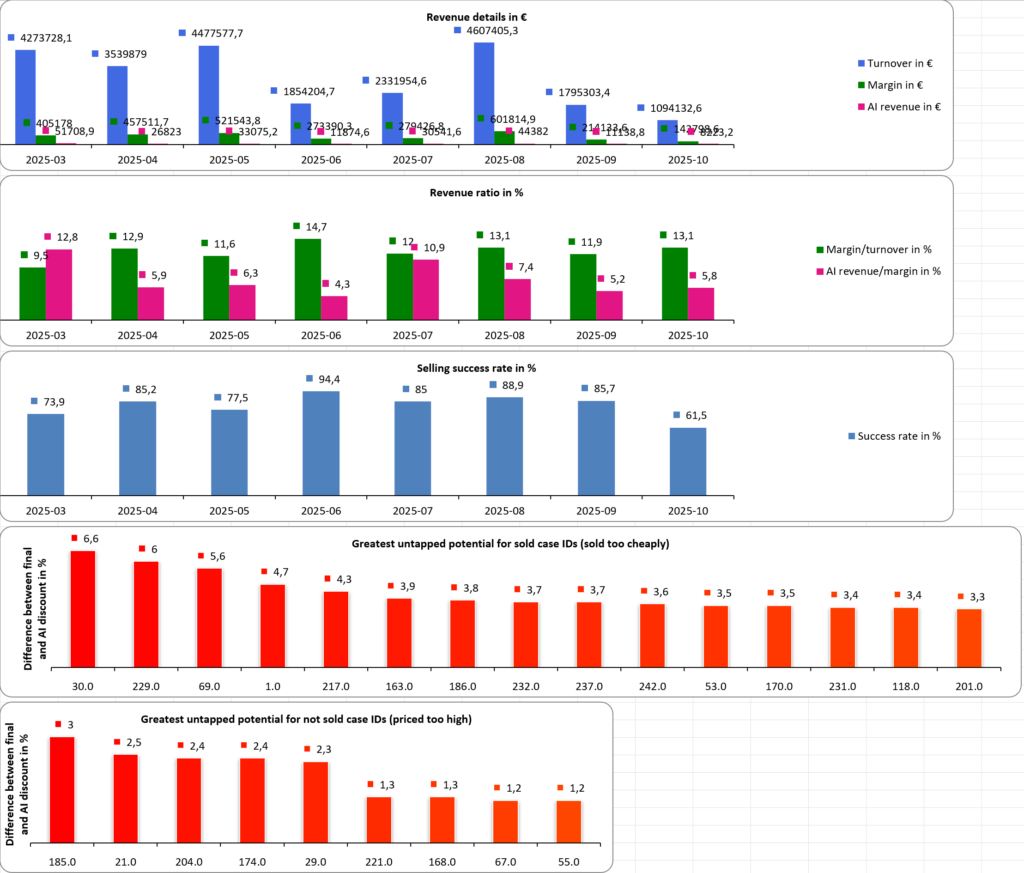
Generated automatically after each run – turnover, margin, AI revenue, success rate and the cases with the greatest untapped potential.